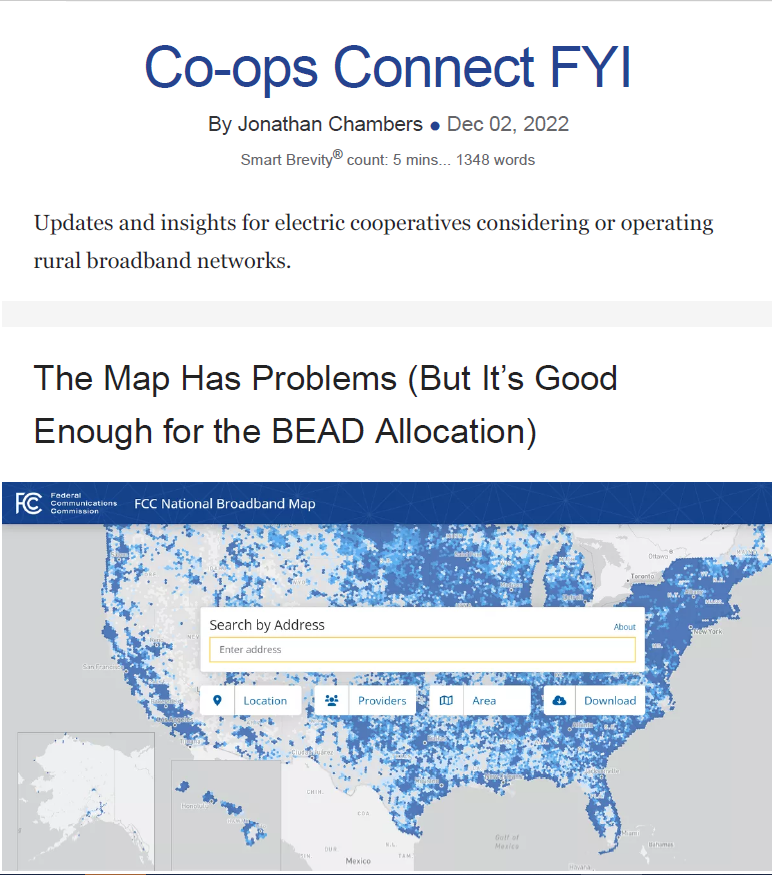
The Map Has Problems (But It’s Good Enough for the BEAD Allocation)
December 2, 2022
First, a tip of the hat to Mike Conlow, who has done some excellent work analyzing the data from the new FCC maps. I recommend checking out his recent piece.
The FCC is using a new proprietary dataset of its own creation to calculate the number of Broadband Serviceable Locations (BSL).
- BSLs are structures, both residences and certain small businesses, that could receive broadband.
- In the past, the FCC relied largely on Census Bureau data, such as housing units. Housing units, households, business establishments, and population are all common well-known metrics.
- BSLs are not. This new BSL designation is a novel measure of the country’s demographics.
Why it matters:
The FCC has allowed challenges to the BSL data, but only by ISPs and state and local governments. There has been no peer review, no access to the data by geographers or researchers.
- States have submitted challenges.
- Conexon submitted nearly 50,000 location challenges.
- The FCC has not indicated how the challenges will be adjudicated.
The Importance of the BSL Data
By the numbers:
- According to the FCC, there are 112 million Broadband Serviceable Locations (BSL) in the country.
- According to the Census Bureau, there are 142 million housing units in the country and 8 million employer establishments. There are also millions of community anchor institutions.
— A housing unit is a house, an apartment, a mobile home, a group of rooms, or a single room that is occupied.
— An employer establishment is a single physical location at which business is conducted.
— Community anchor institutions include schools, libraries, health care facilities, churches, and other places of worship.
In the past, the FCC has based its models and maps on housing units, small business establishments, and community anchor institutions. The difference between 112 million and over 150 million is due in part to what the FCC is counting, and due in part to error.
- Perhaps the FCC’s new method of counting some structures is better.
- A difference in a count of 40 million leaves a lot of room for error.
- We have estimated the FCC missed over 10% of potential BSLs.
What the FCC should have done — and can still do:
Congress, the states, and the public should be skeptical unless the FCC makes the data available to the public.
- To be clear, the FCC has not made the BSL data, the location fabric, available to the public.
- The FCC spent tens of millions in public dollars on the location fabric and has not permitted the public to review the data.
- The FCC’s refusal to make public this data will undermine credibility in its critical work.
Let’s go deeper.
According to Mike Conlow’s analysis of the 112 million BSLs, which matches our initial review:
- 7.7 million lack access to 25/3 Mbps service provided by copper, coax or fiber or by fixed wireless using licensed spectrum. Those locations are considered unserved.
— The BEAD state allocation will be based on the percent of unserved locations in a state.
- Another 6 million lack access to 100/20 Mbps service. Those locations are considered underserved.
- Only unserved and underserved locations are available for BEAD funding.
Does 13.7 million unserved and underserved locations sound right?
- Less than 14 million unserved and underserved locations is a low figure.
- Many in the industry were anticipating a number greater than 20million. But new, unverified claims by fixed wireless providers dramatically reduced the number of unserved and underserved locations.
- To be eligible for BEAD funding, those locations must not be part of another broadband funding program, such as CAF, CARES, RDOF, ReConnect, or ARPA.
- To date, 7-8 million locations have been funded by those programs, and more will be funded prior to BEAD.
- That leaves only 5-6 million locations for $42.45 billion in funding.
That’s a train wreck. It’s too much per location, and too few locations.
Let’s Go to the Maps
Just about everyone who looks at the broadband map puts their own address into the search tool.
I entered my Colorado home address and was shown the following.
(Source: broadbandmap.fcc.gov)
Green means served, which would be news to my neighbors.
- I changed the setting to include only wired and licensed fixed wireless.
- The map’s display changed to red, or unserved.
(Source: broadbandmap.fcc.gov)
Why it matters:
Some members of Congress have recently suggested unlicensed fixed wireless should be adequate for rural America.
- The damage to rural America of such a policy would be incalculable.
- NTIA got this one partially right.
Go Deeper
In looking at the FCC map of my home, I discovered a couple of things
about broadband availability.
1. T-Mobile claims 200 Kbps symmetrical fixed wireless service.
— It is such a baldly incorrect claim that one could easily dismiss it as an error.
— T-Mobile does not have coverage in rural areas generally and certainly not in the Colorado Rockies.
— But T-Mobile claims fixed wireless service throughout the country, including 100/20 Mbps service, which would block funding from such areas.
— The bottom line: T-Mobile’s unverified rural claims are going to harm a lot of rural America.
2. SpaceX claims to offer 350 Mbps downstream and 40 Mbps upstream at my home.
That’s great news. If only it were true. I decided to order Starlink immediately. When I input my address and clicked “Order,”.
Why it matters:
Here’s the thing about the FCC’s collection of data from internet providers:
- Under the FCC’s rules, to claim that service is available, the internet service provider must be able to make it available within 10 days.
- “We’ll let you know next year” doesn’t cut it.
Back to the Maps
Map of availability for Conexon headquarters in the Crossroads neighborhood of KansasCity, Missouri (Source: broadbandmap.fcc.gov)
Next, I decided to look at other locations, such as the Crossroads in Kansas City, where Conexon has its headquarters.
Our office in Kansas City.
- Oddly, the neighborhood around our office, which has a mix of residential and business locations, appears on the new map as largely unserved by wired 25/3 Mbps or licensed wireless.
- The new map contains a significant amount of overcounting and undercounting.
SpaceX claims service in the Crossroads, too. So, I checked their website and found this for our office location.
You get the idea. It’s the same message as before.
- So I tried several other locations where Starlink reported service availability and always got the same message.
- Service may be available next year, but it is not currently available and certainly not within 10 days.
Why it matters:
SpaceX reported to the FCC that it has service availability at over 106 million locations in the country.
- These reports are filed under penalty of perjury.
- SpaceX should probably clean up its filing. Tens of millions of counts of perjury would be a lot.
The Big Picture
NTIA has indicated it will wait until the challenges are complete and a new set of maps are produced.
Problems aside, there is no need to wait to calculate the BEAD allocation.
- The FCC is going to spend another six months or longer working through challenges to this iteration of the map.
- This map has been years in the making and will never be finished.
The Infrastructure Act required that NTIA calculate the state allocation once this map has been made public.
- There is enough data for a reasonable allocation of the BEAD funding.
- In fact, if you compare an allocation of BEAD funds based on this map with an allocation based simply on housing units, you get nearly the same allocation.
- You get approximately the same allocation if you use households, population, road miles, rooftops, cars, churches, or Starbucks locations.
The bottom line:
The map will improve. But delaying the BEAD program for the next round of maps is an exercise in false precision.
Why should rural America wait for that? Let’s get on with it.